How to track your branded app with App Analytics
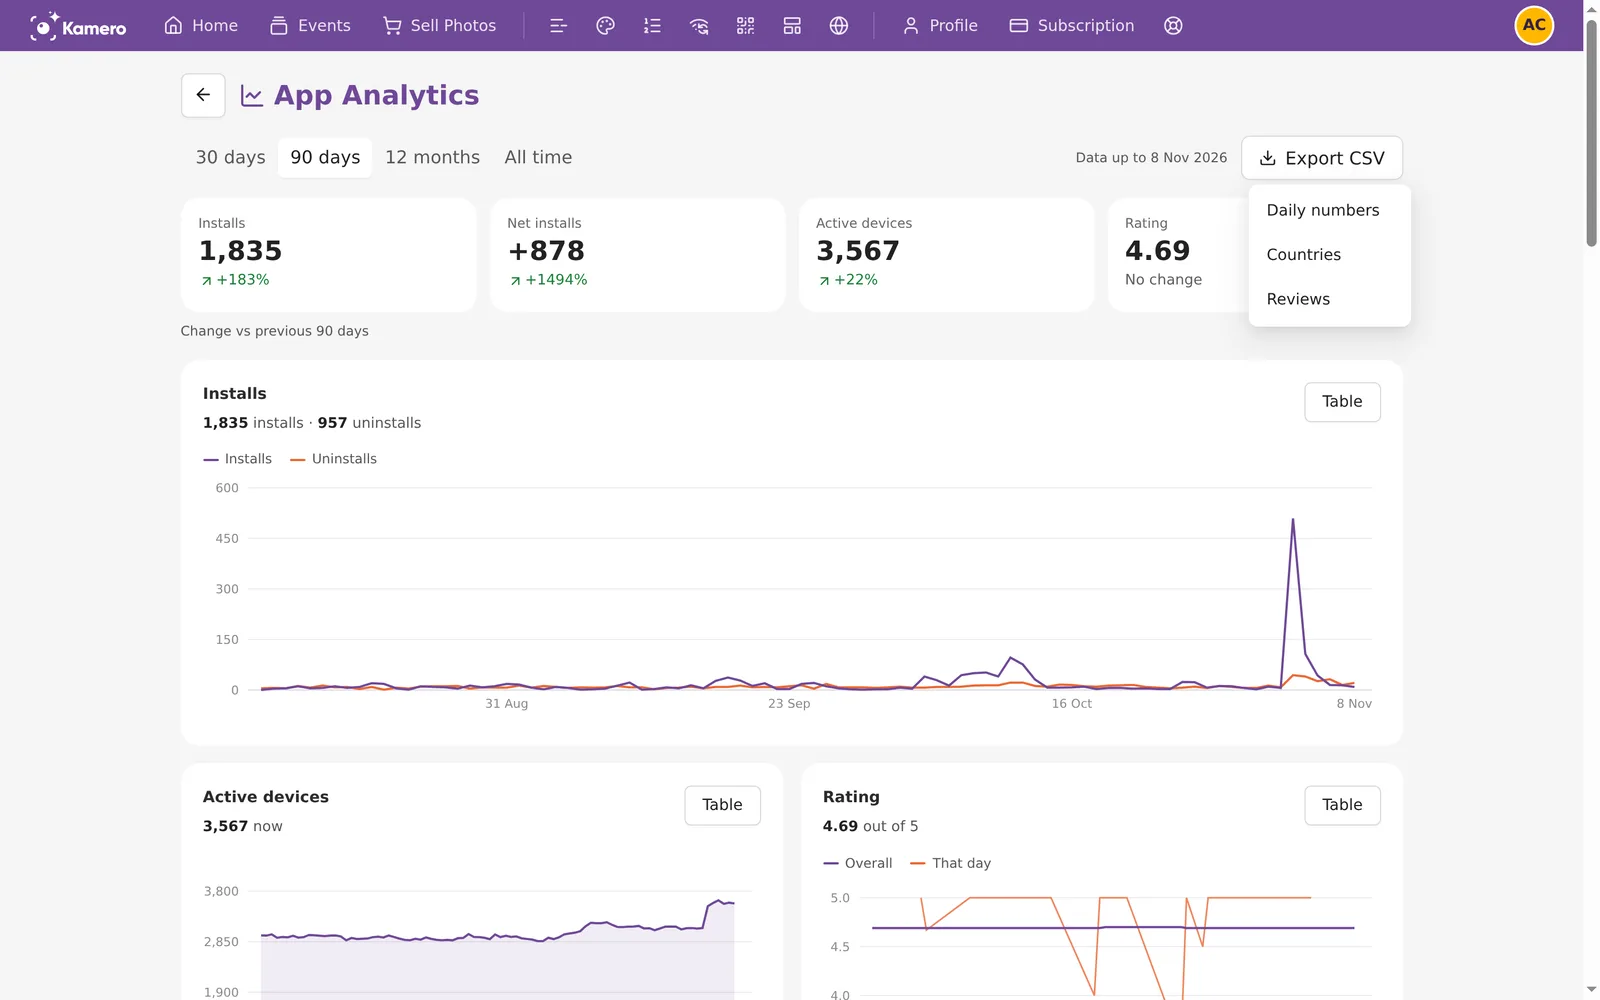
If your studio has its own branded app on Google Play, the App Analytics page shows how it is doing. You can see how many people install and remove it, how many devices use it, its rating, how many store visitors become installs, and where your users are. You can also read your reviews and reply to them without opening the Play Console.
Who can see App Analytics
The page is only for the admin of a branded app. If your guests use the standard Kamero app, the menu item is not shown. To learn what a branded app includes, see App features.
How to open App Analytics
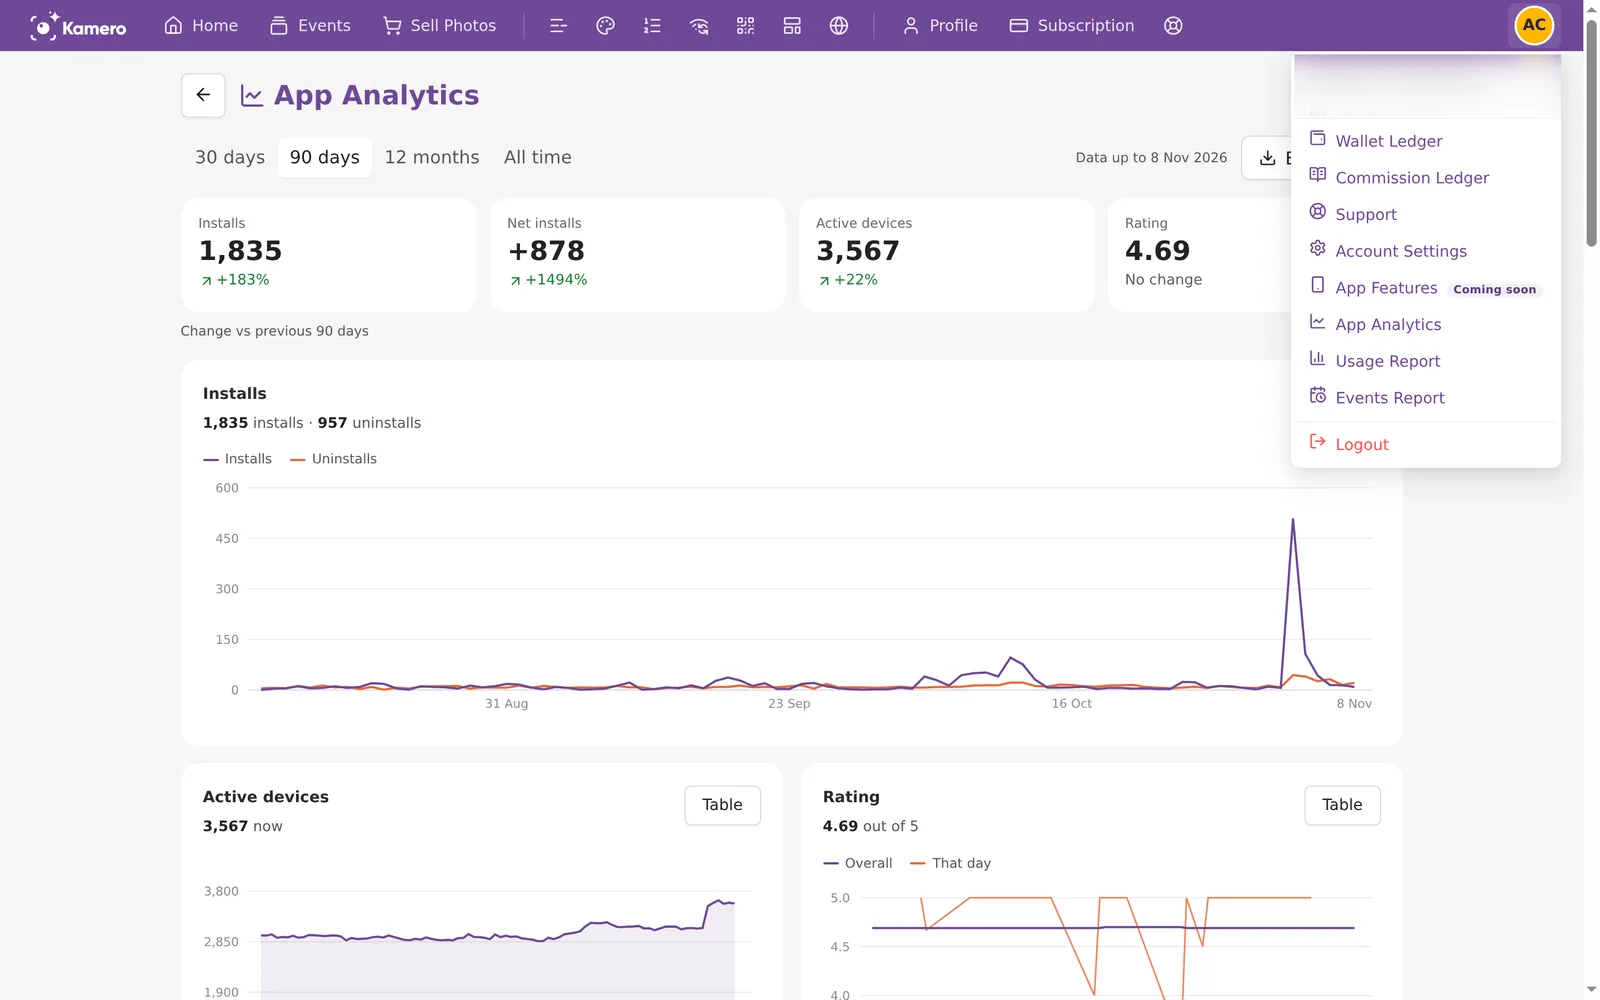
- Click your profile picture at the top right of the dashboard.
- Choose App Analytics.
Pick a date range
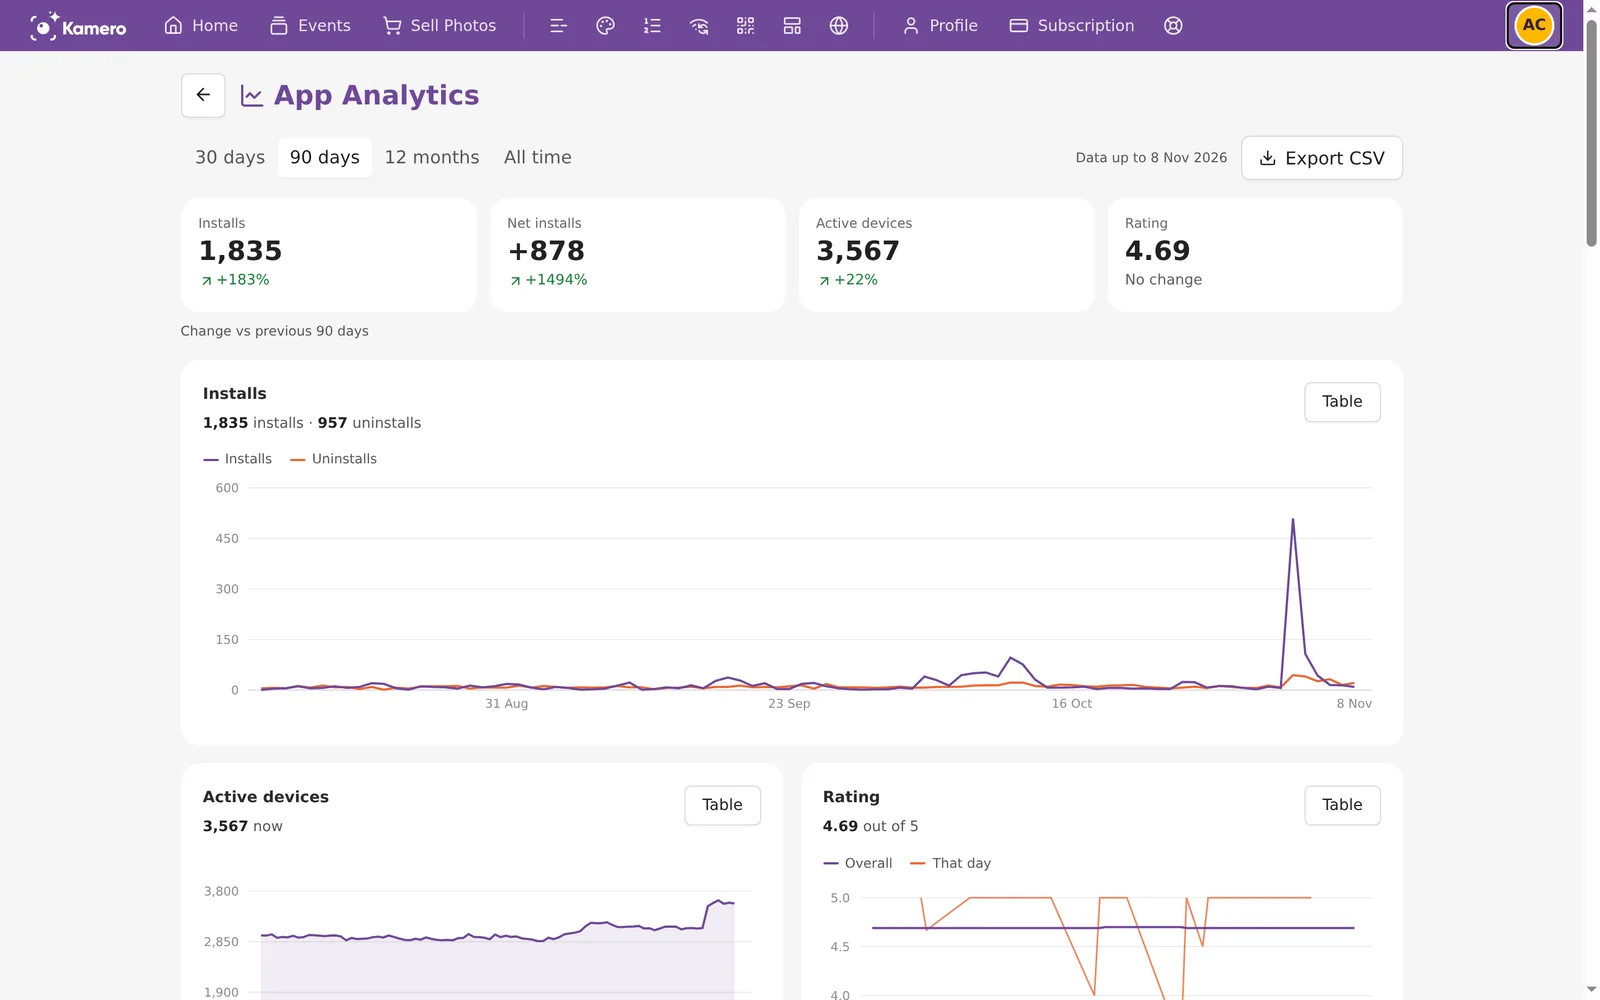
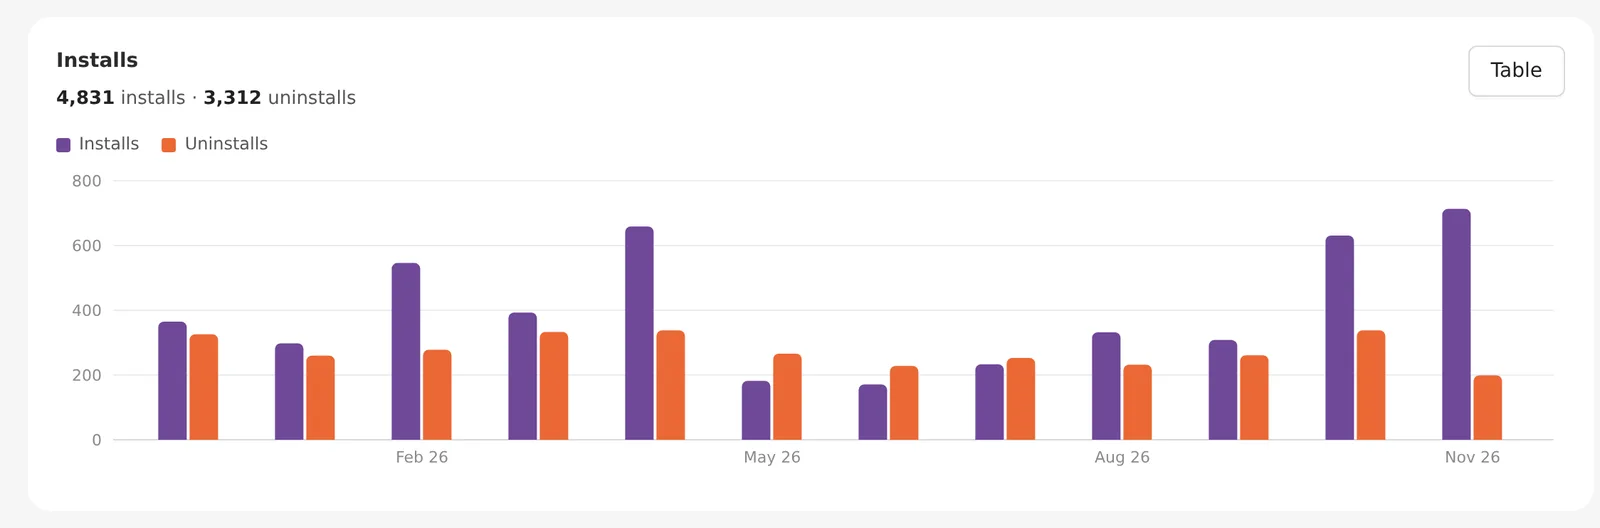
Use the buttons at the top to choose 30 days, 90 days, 12 months or All time. The page opens on 90 days. With 30 or 90 days, the charts show one point per day. With 12 months or All time, they show one bar per month.
Google Play sends its numbers about two days late. The date next to Export CSV, such as "Data up to 8 Nov 2026", is the last day with data. A dash means there is no number for that day yet. A 0 is a real zero.
The summary tiles
- Installs: how many times your app was installed in the range.
- Net installs: installs minus uninstalls. A positive number means your app gained users.
- Active devices: devices that used your app in the last 30 days, on the last day of the range.
- Rating: your average star rating out of 5.
Under each number is the change against the period before it, for example "Change vs previous 90 days". Green means up. All time has no comparison.
The charts
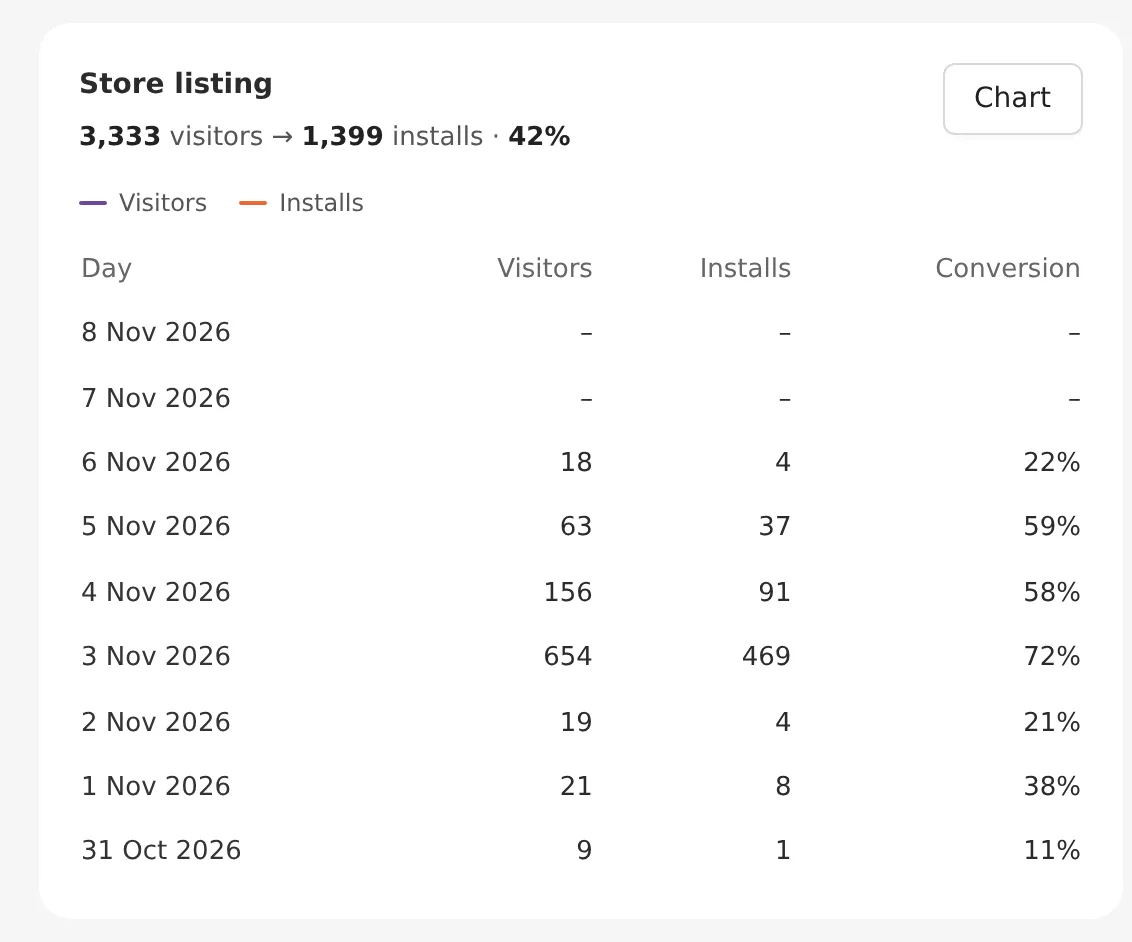
Each chart has a Table button that shows the same numbers as a list, one row per day or month. Click Chart to go back.
Installs
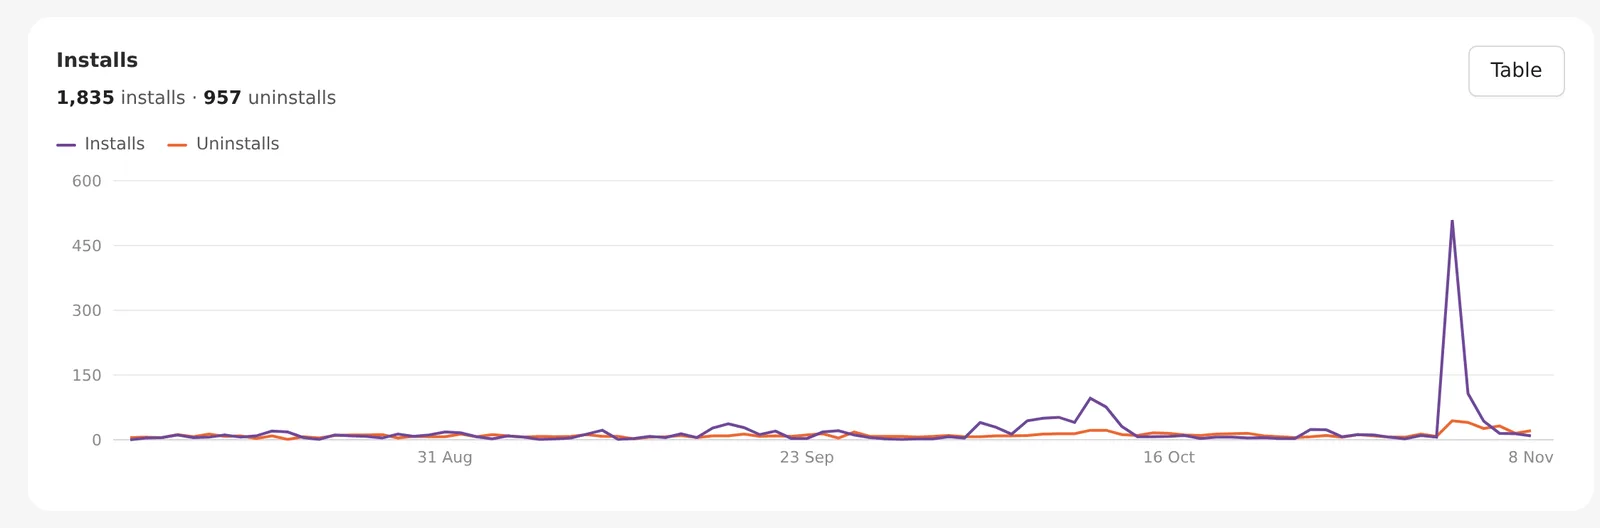
Installs and uninstalls on the same chart, with the totals for the range above it. A spike in installs often follows a big event, when many guests download the app to find their photos.
Active devices
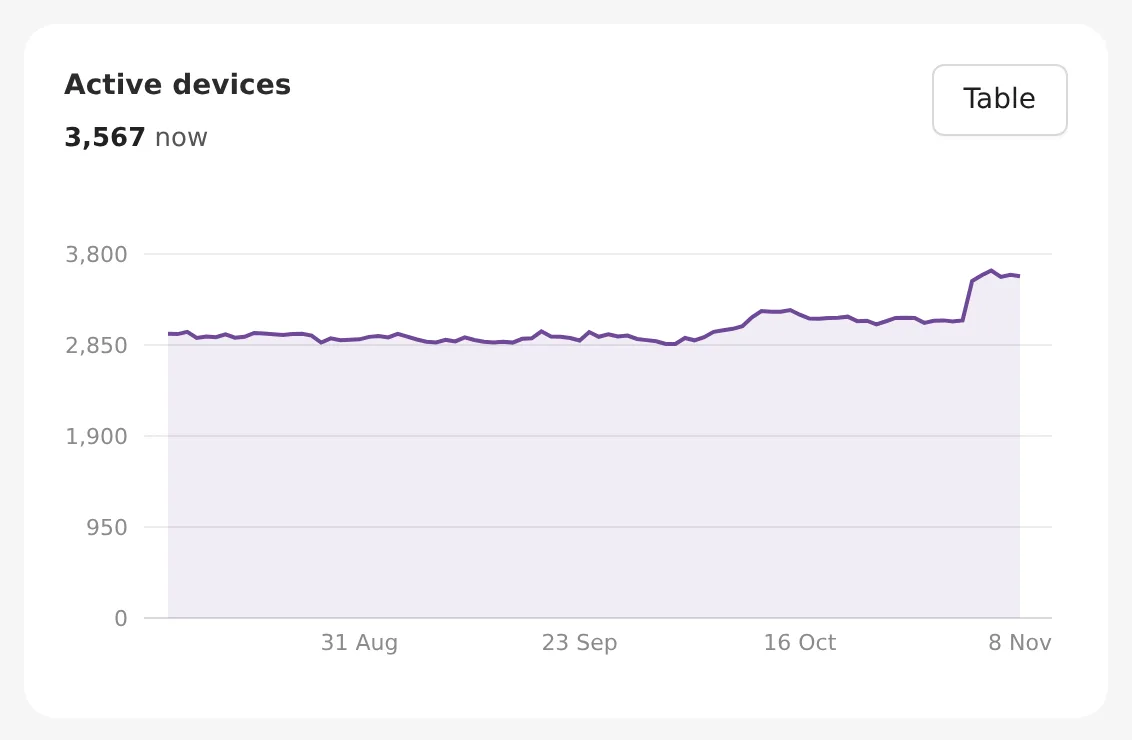
How many devices used your app in the 30 days before each day. The number above the chart is the latest one.
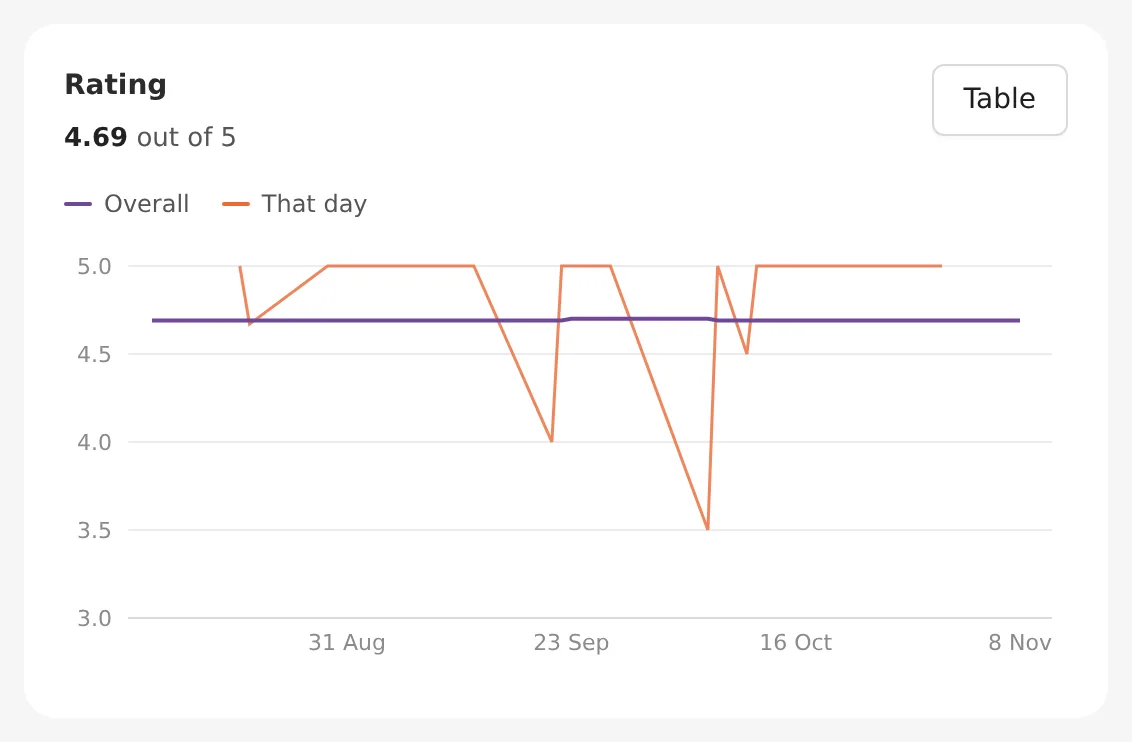
Rating
Overall is the average of every rating your app has had so far. That day is the average of the ratings left on one day, so it jumps when only one or two people rate. With 12 months or All time, it becomes That month.
Store listing
This card shows how well your Play Store page turns visitors into installs. It reads like "3,333 visitors → 1,399 installs · 42%". Visitors are people who opened your app's page in the Play Store. Installs are the visitors who then installed it. The percentage is the conversion rate.
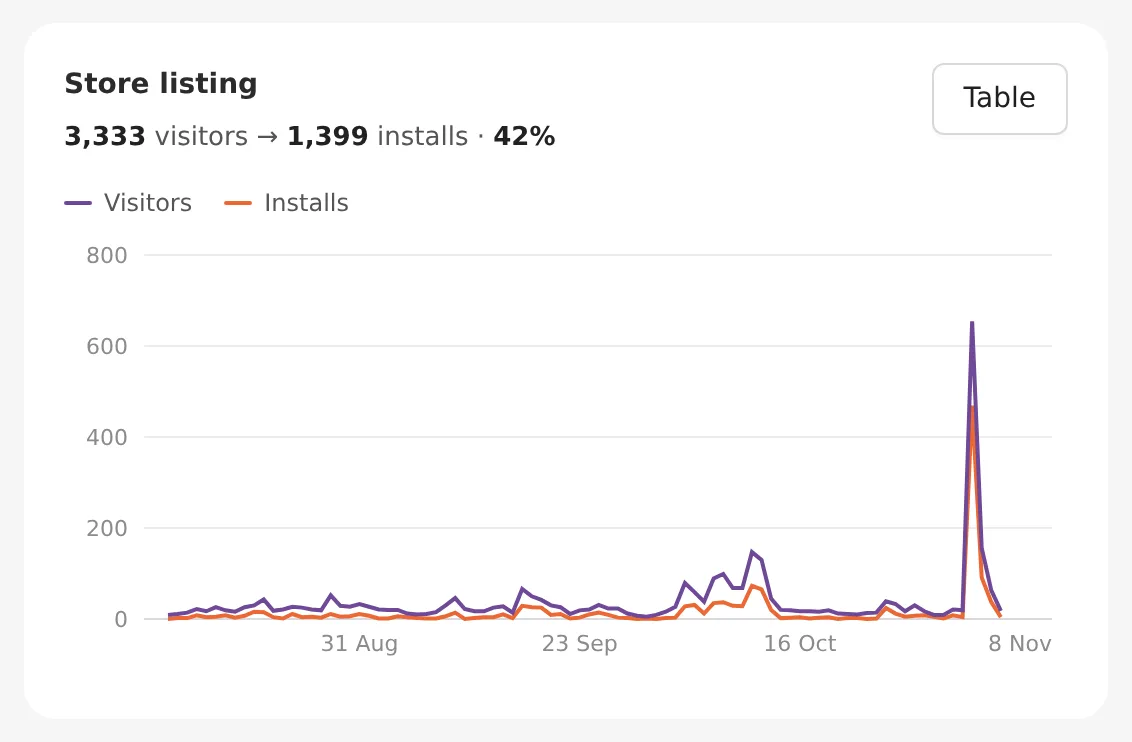
In the table view, each day shows its visitors, installs and Conversion.
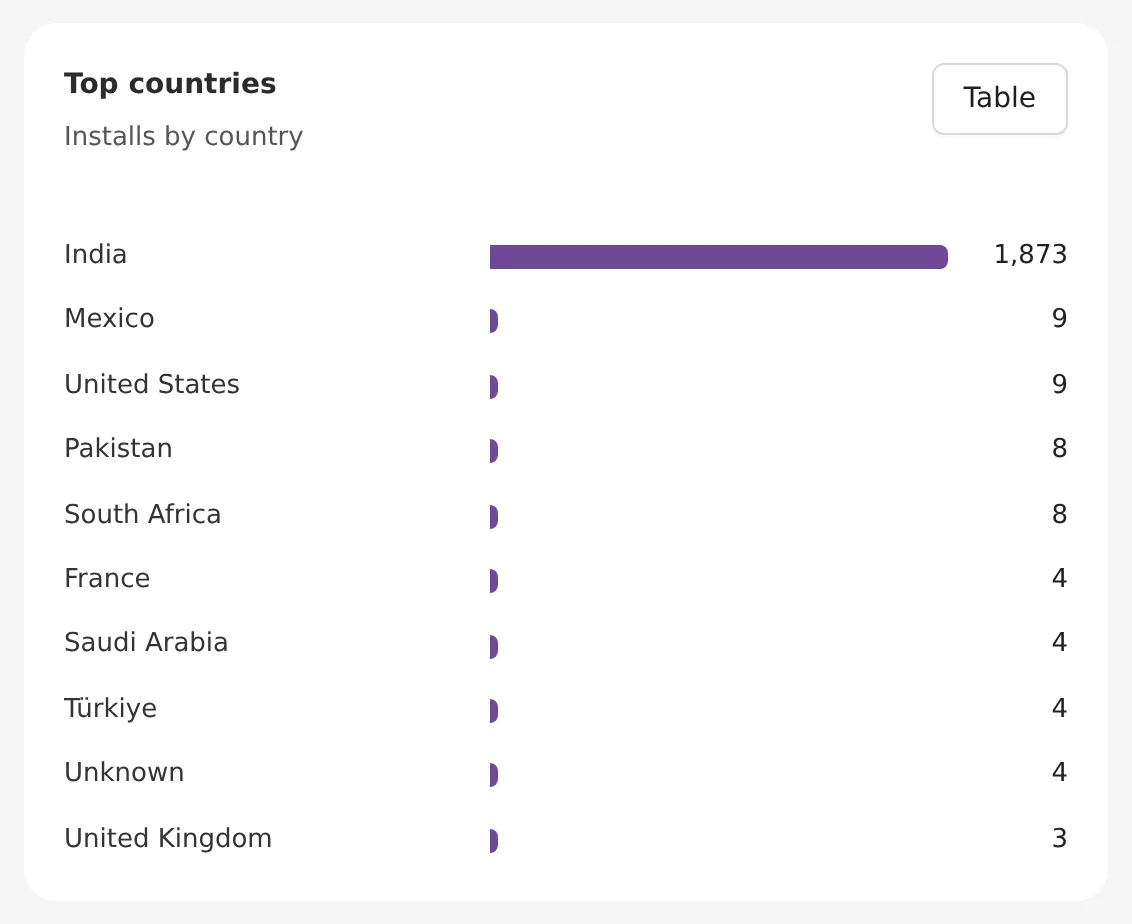
Top countries
Installs by country for the range, largest first.
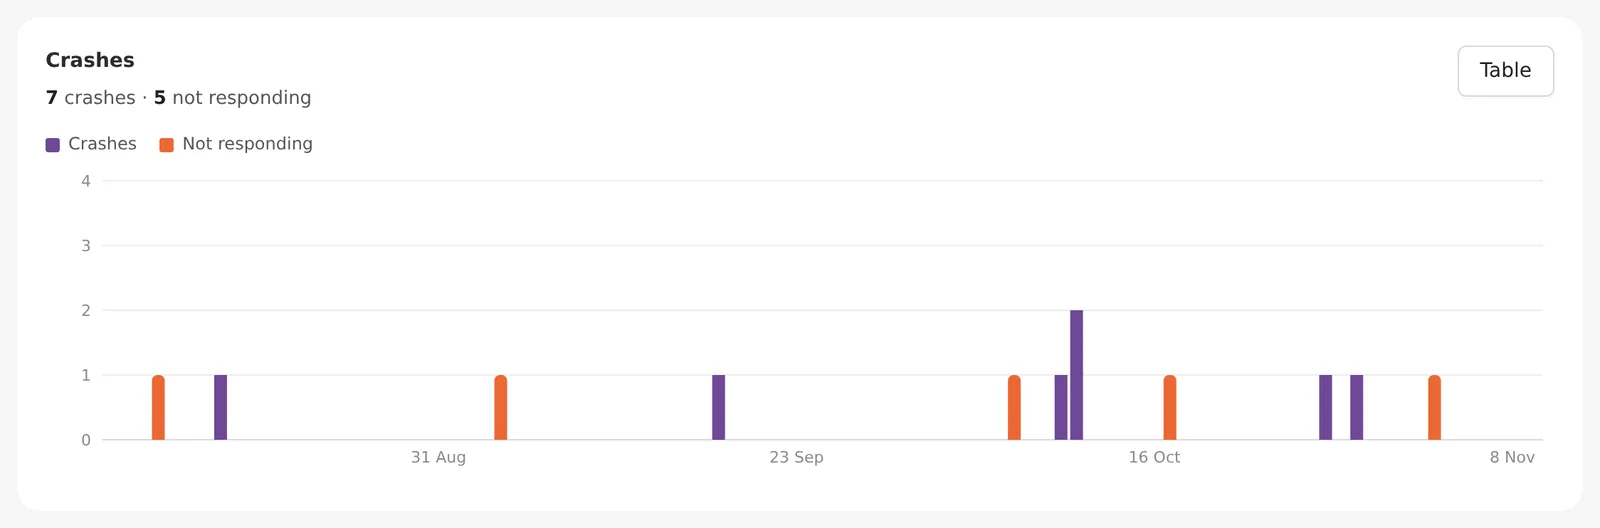
Crashes
How often the app crashed or stopped responding on your users' phones. This card only shows when there was at least one crash or freeze in the range.
Monthly view
With 12 months or All time, the charts switch to one bar per month. This makes it easier to spot your busy seasons.
Reviews
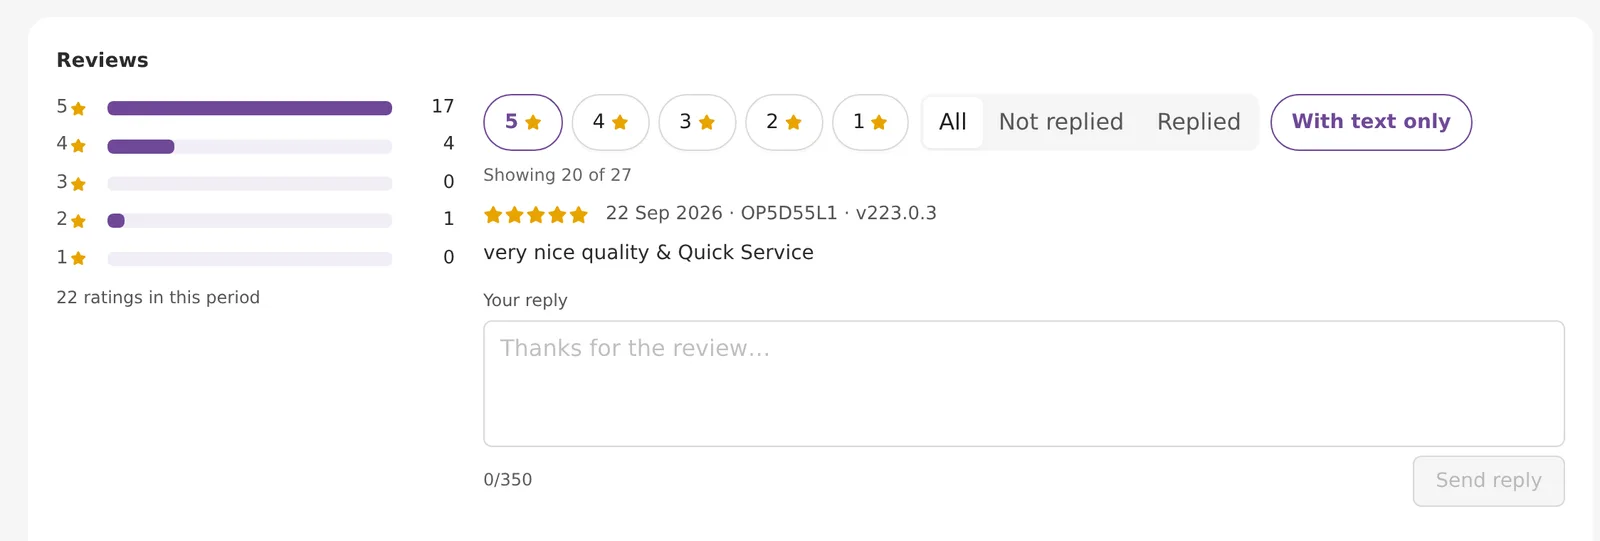
On the left, you see how many ratings of each star you got in the range. On the right is the list of reviews, newest first. Each review shows its stars, date, the phone model and the app version.
To narrow the list:
- Click a star button to show only reviews with that rating.
- Choose All, Not replied or Replied.
- Click With text only to hide ratings that have no comment.
The list loads 20 reviews at a time. Click Show more at the bottom for the next ones.
How to reply to a review
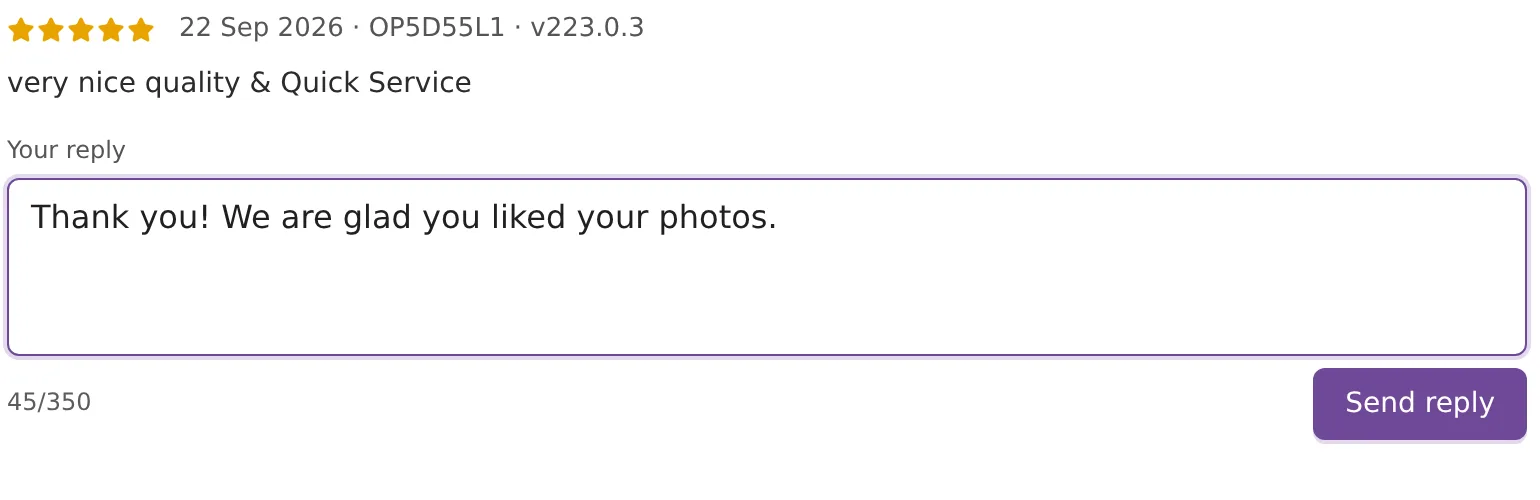
- Find the review. Use Not replied to see the ones still waiting.
- Type your answer in the box under the review. You can use up to 350 characters.
- Click Send reply.
Your reply is posted on Google Play, where everyone can read it. To change it, click Edit reply. Some old reviews can no longer be answered, and those have no reply box.
Export to CSV
Click Export CSV and choose what to download for the selected range:
- Daily numbers (or Monthly numbers with 12 months or All time): installs, uninstalls, net installs, active devices, ratings, store visitors, conversion, crashes and freezes.
- Countries: installs per country.
- Reviews: every review with its stars, text, date, language, app version and your reply.
Frequently asked questions
Why don't I see App Analytics in my menu?
App Analytics is only for studios with their own branded app on Google Play, and only for the admin of that app. If you use the standard Kamero app, the page is not shown.
Why are the last two days empty?
Google Play publishes its numbers about two days late, so the page always ends a couple of days before today. The date next to Export CSV tells you the last day with data. Days that Google Play has not sent yet show a dash.
What is the difference between a dash and 0?
A dash means there is no number for that day yet. A 0 means Google Play measured that day and the count was zero.
Do my replies show up on Google Play?
Yes. When you click Send reply, the reply is posted on Google Play under the review, where anyone can read it. You can change it later with Edit reply.
Why does the Installs tile not match the Store listing installs?
The Installs tile counts every install of your app. The Store listing card counts only installs by people who opened your app page in the Play Store, so it is usually smaller.
Why does the That day rating line jump around?
That day is the average of the ratings left on one day. On a day with only one or two ratings, a single low score pulls it down a lot. The Overall line is the average of every rating so far, so it moves slowly.
More Reports & account tutorials
Try it in your dashboard
Sign in to Kamero and follow along. Questions? Raise a support ticket from the dashboard.