How to read your Usage Report
The Usage Report sums up everything your account has done on Kamero. It shows how many events you made, how many photos they hold, which photo packs and add-ons you bought, and how each event used its photos. It is useful when you plan your next plan or pack, or when you want a year-by-year view of your work.
How to open the Usage Report
- Click your profile picture at the top right of the dashboard.
- Choose Usage Report.
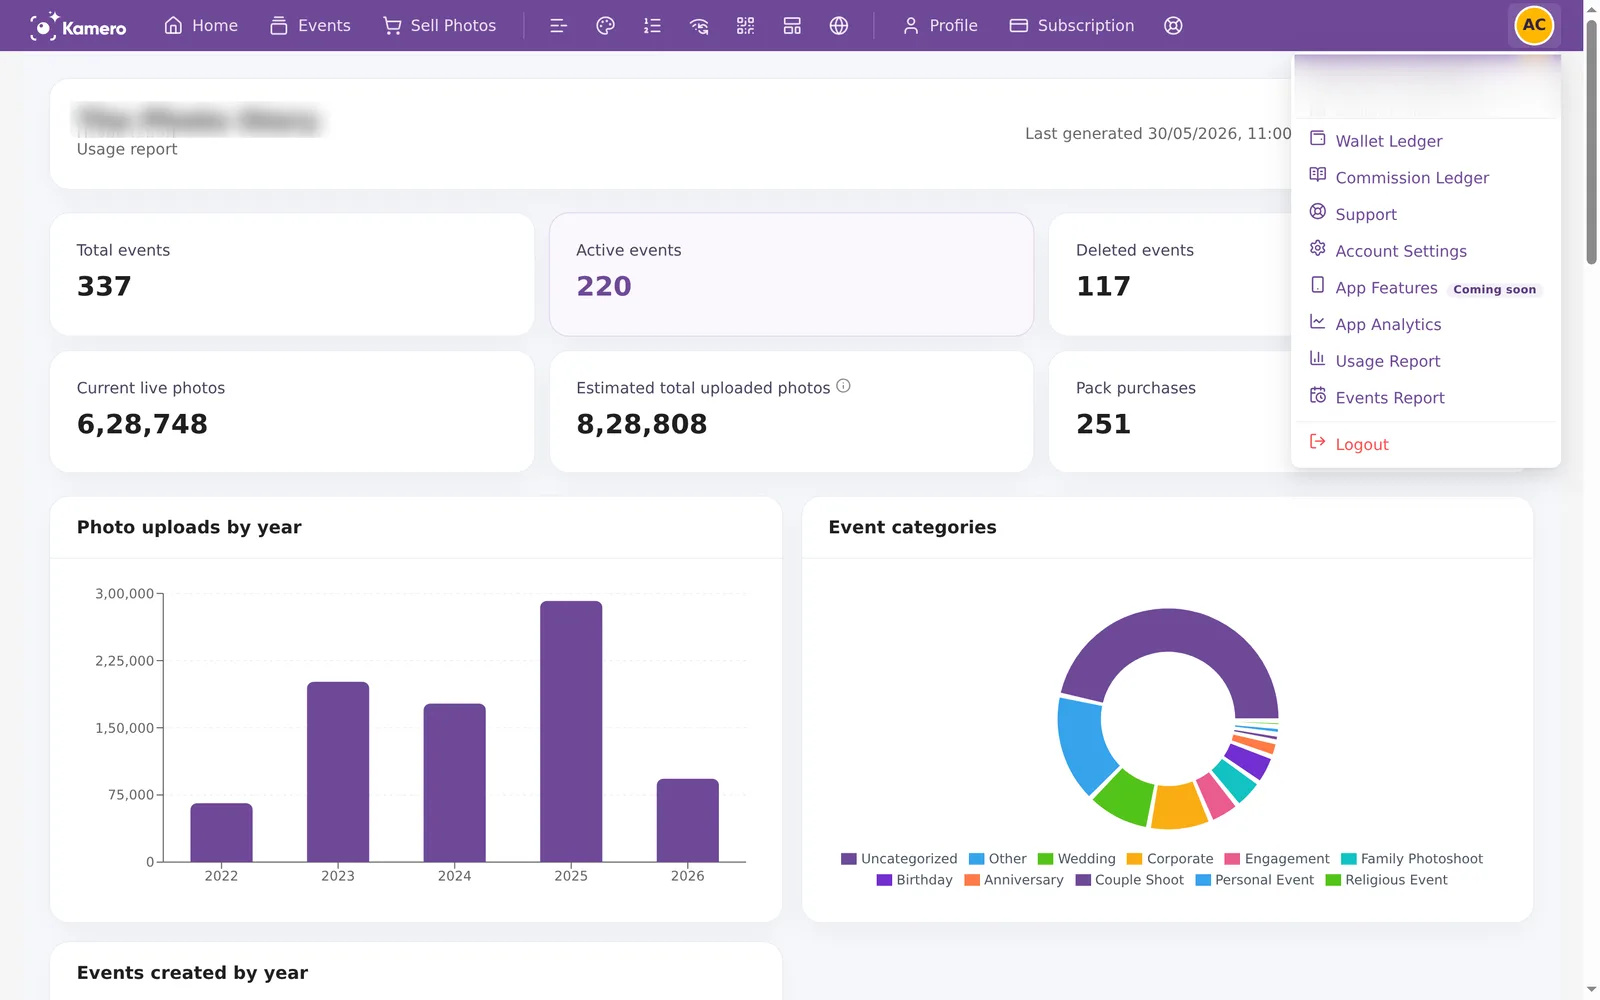
The first time you open it, the report may not be ready yet. You see "We are preparing your usage report." It can take a few minutes, and you get an email when it is ready. You can leave the page and come back.
A snapshot of your whole account
The report covers your whole account, from your first event onwards. There is no date range to pick. Instead, the charts and tables split the numbers by year.
The report is not live. The time next to Last generated tells you when it was made. To get fresh numbers, click Refresh report. The new report is built in the background, and you can refresh once every 24 hours.
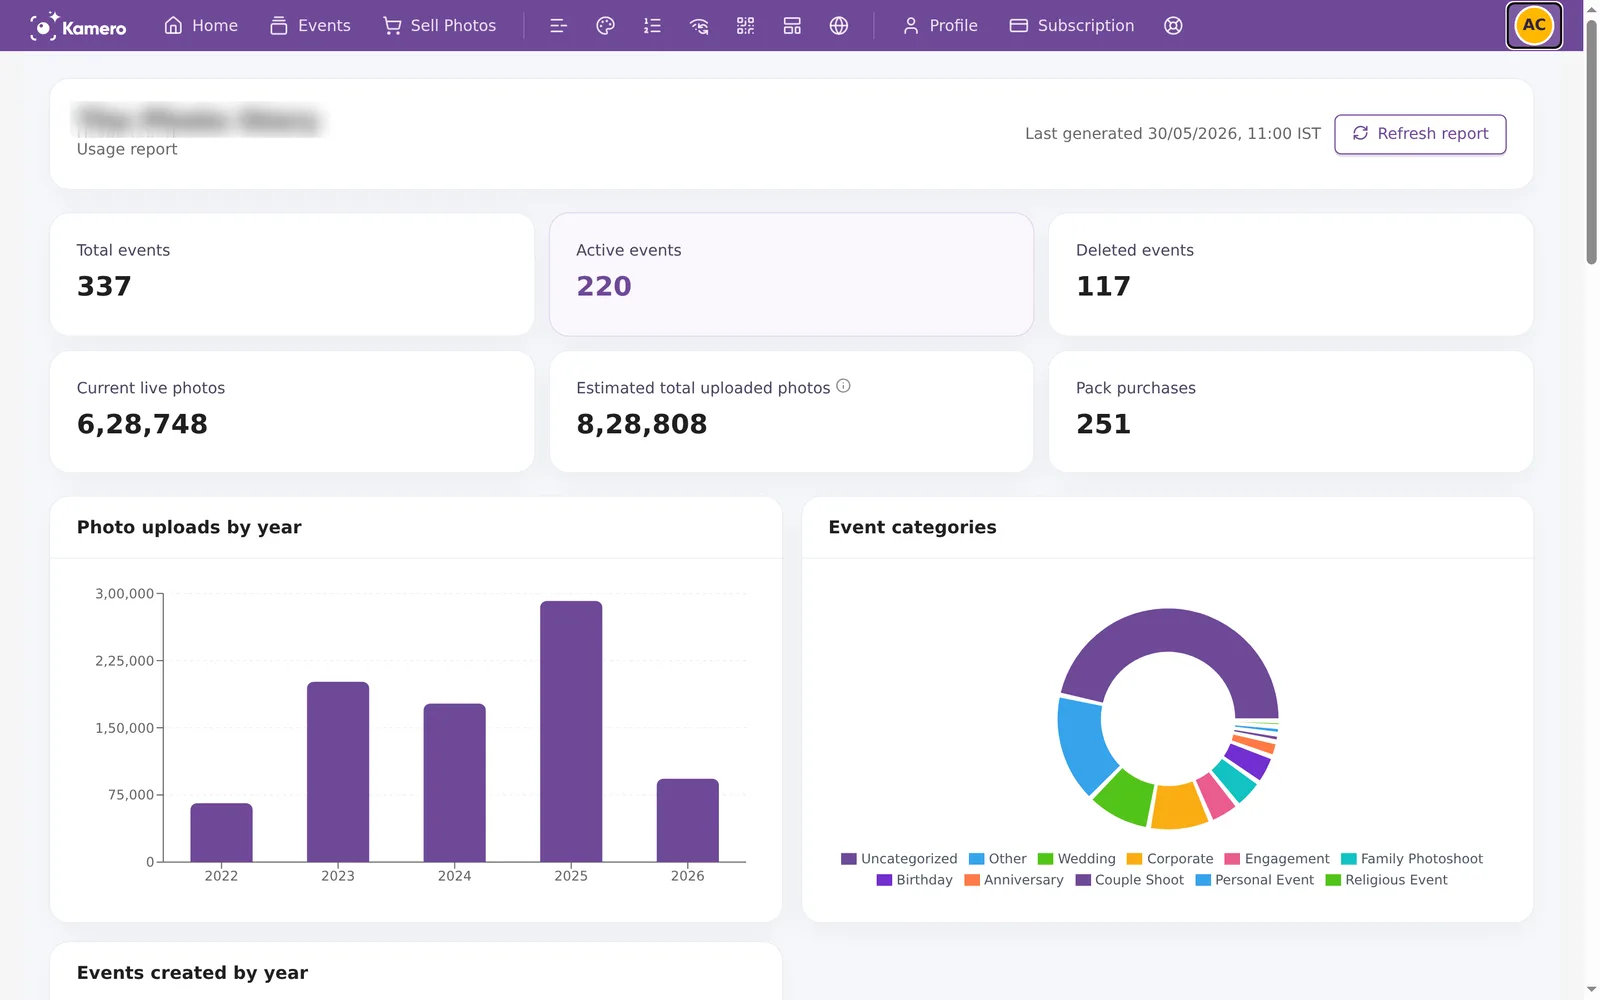
The summary tiles
- Total events: every event you have created, including deleted ones.
- Active events: events that are still live.
- Deleted events: events that were deleted.
- Current live photos: photos that are in your events right now. Deleted photos are not counted.
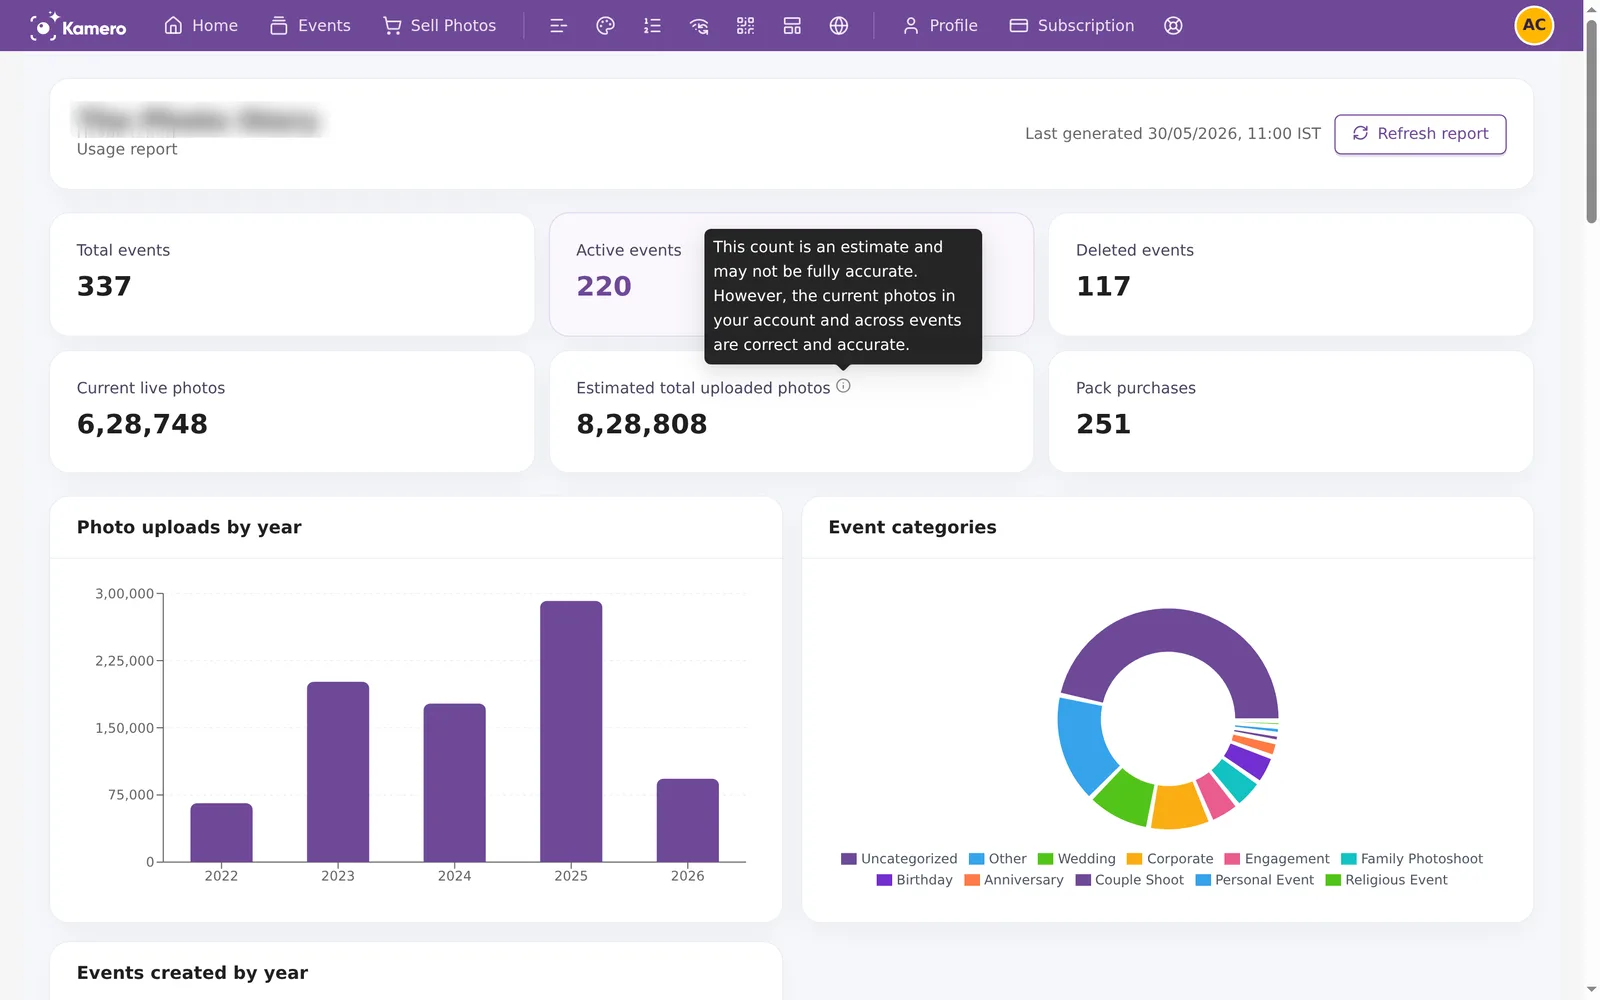
- Estimated total uploaded photos: every photo you have uploaded, including ones you deleted later. It is an estimate.
- Pack purchases: how many photo packs and add-ons you have bought.
Hover over the i icon next to Estimated total uploaded photos to see that it may not be exact. Current live photos is always exact.
The charts
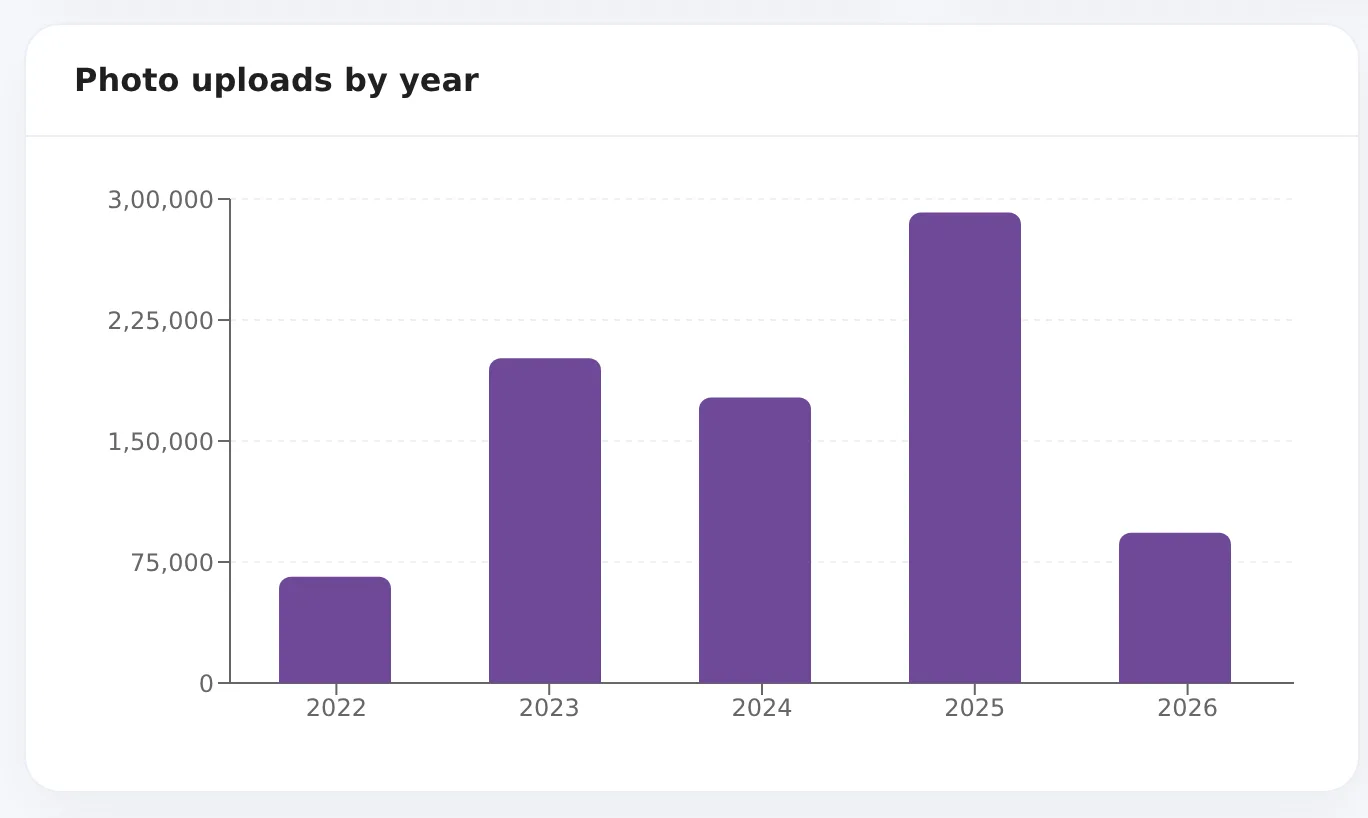
Photo uploads by year
The number of photos per year. Each photo counts under the year its event was created, not the day you uploaded it.
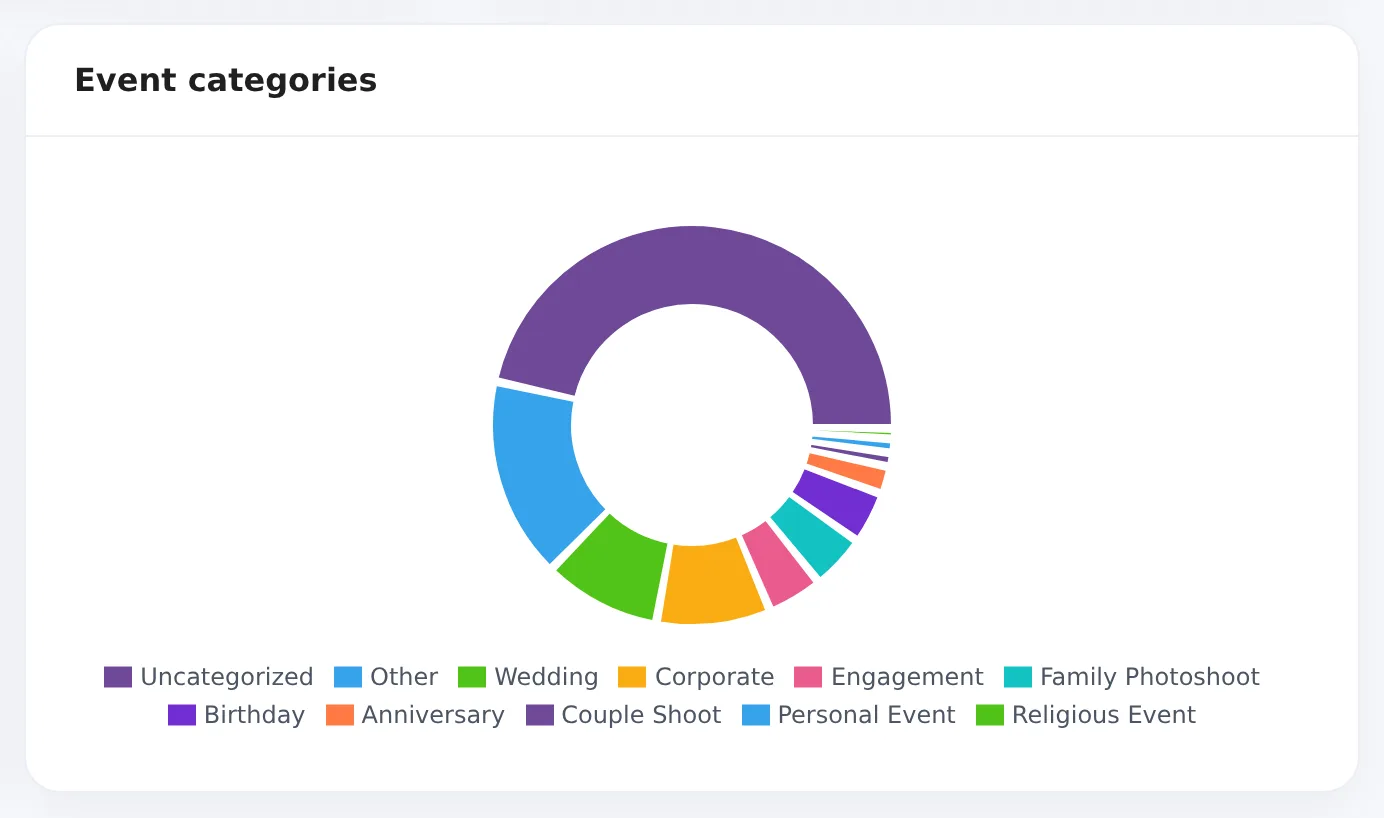
Event categories
How your events split across categories such as Wedding, Corporate or Birthday. Events with no category show as Uncategorized. Hover over a slice to see its count.
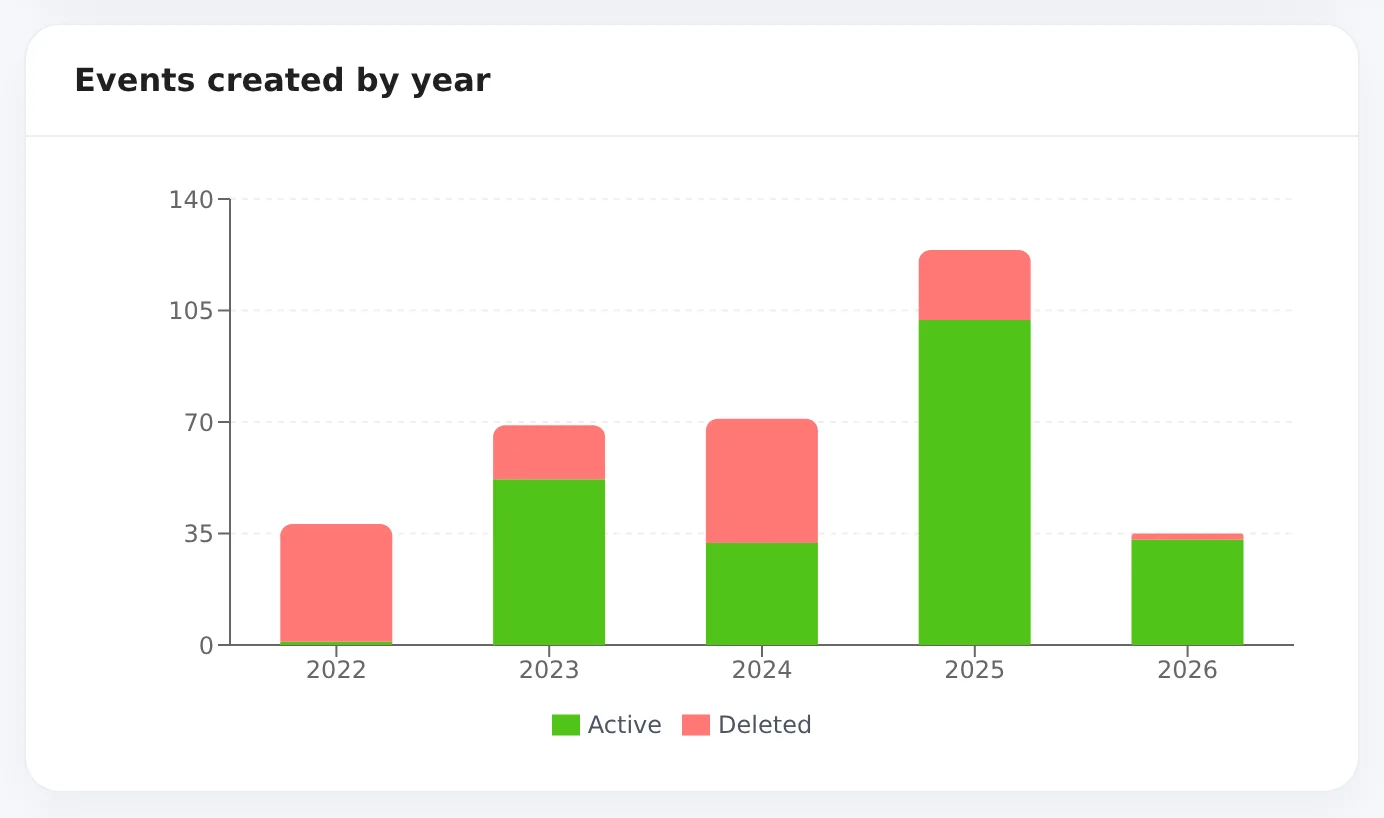
Events created by year
Each bar is one year. It shows how many events from that year are still active and how many were deleted.
The tables
Below the charts is a reminder that current photo counts leave out photos you already deleted.

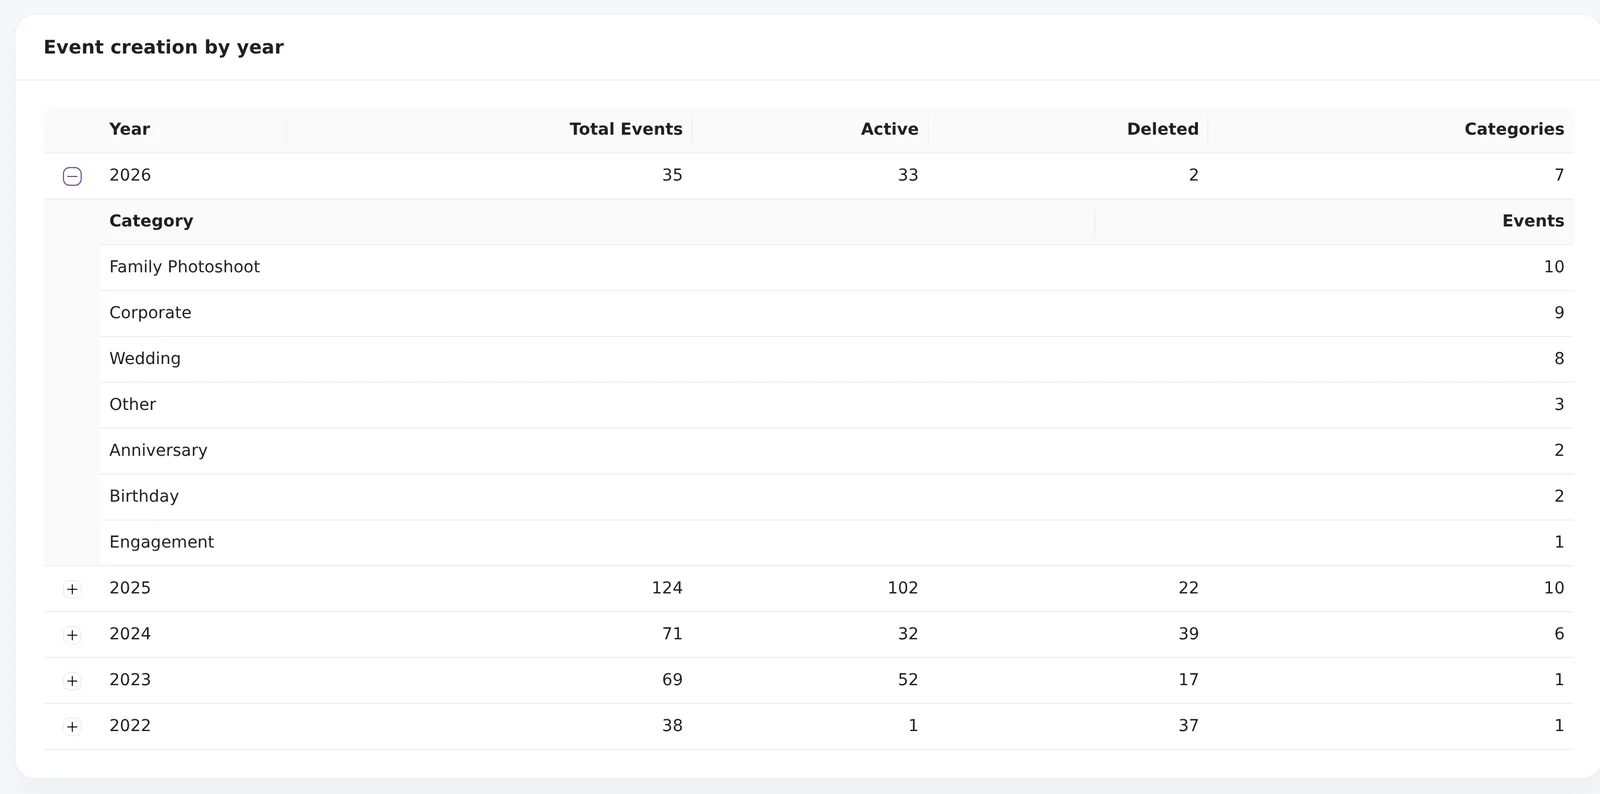
Event creation by year
One row per year with Total Events, Active, Deleted and the number of Categories used. Click the + next to a year to see how many events you made in each category that year.
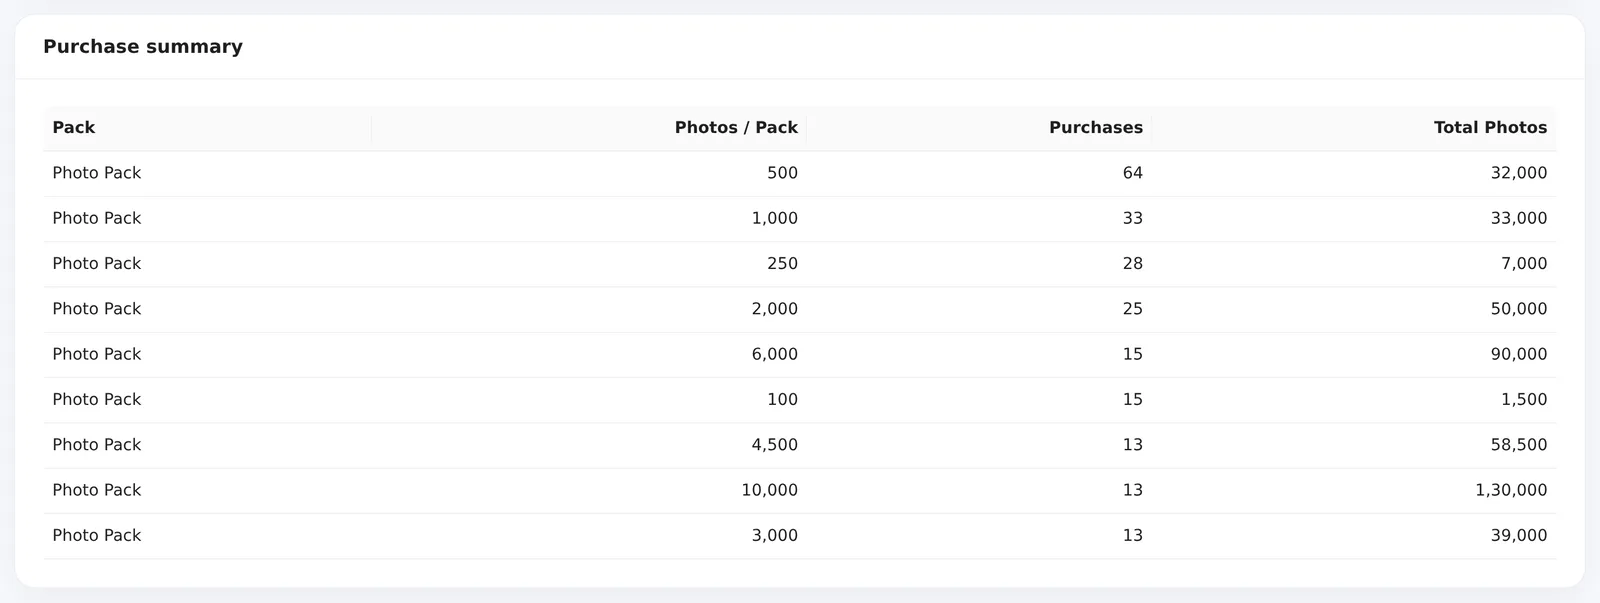
Purchase summary
Every photo pack you have bought, grouped by size. Each row shows Photos / Pack, how many times you bought it (Purchases) and the Total Photos those packs added. To buy more, see Subscription plans and buying.
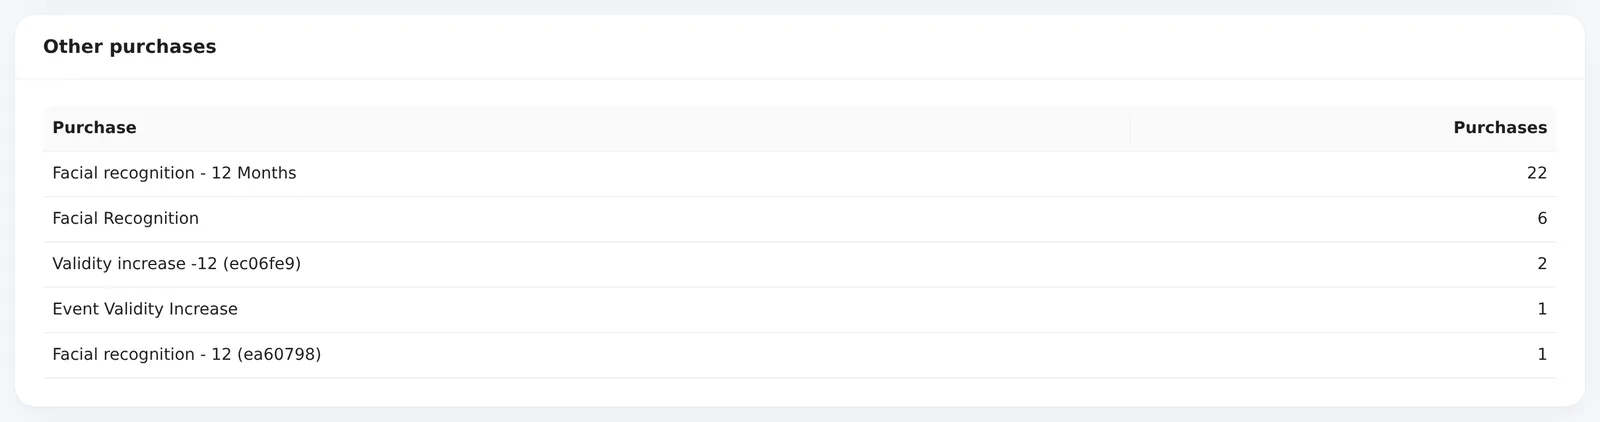
Other purchases
Add-ons that are not photo packs, such as facial recognition or extra event validity, with how many times you bought each.
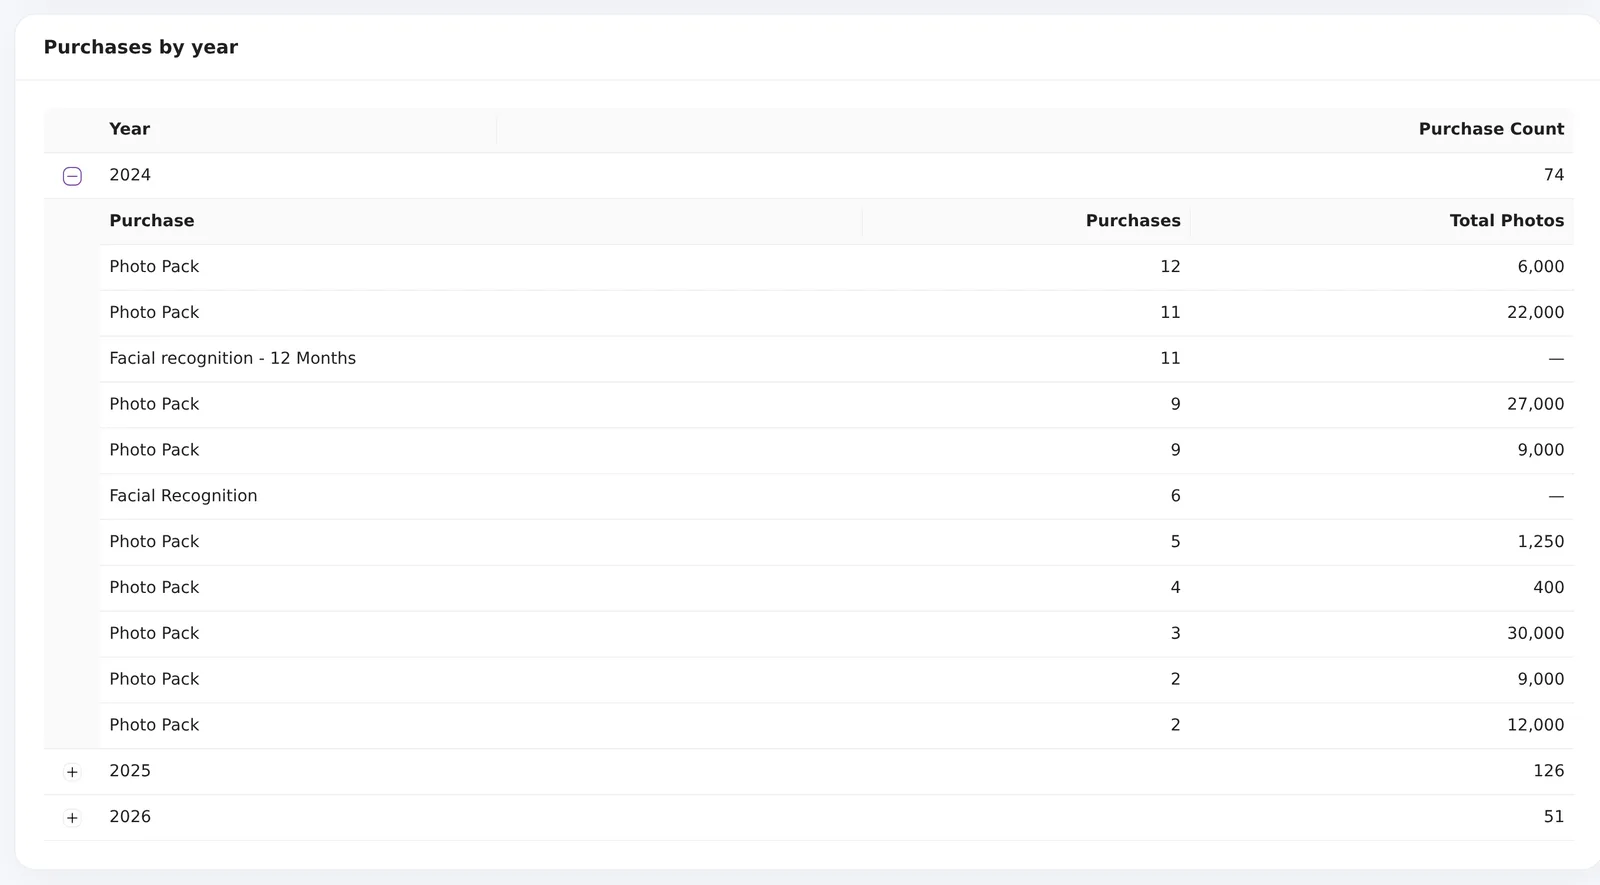
Purchases by year
How many purchases you made each year. Click the + next to a year to see what you bought. Add-ons show a dash under Total Photos because they do not add photos.
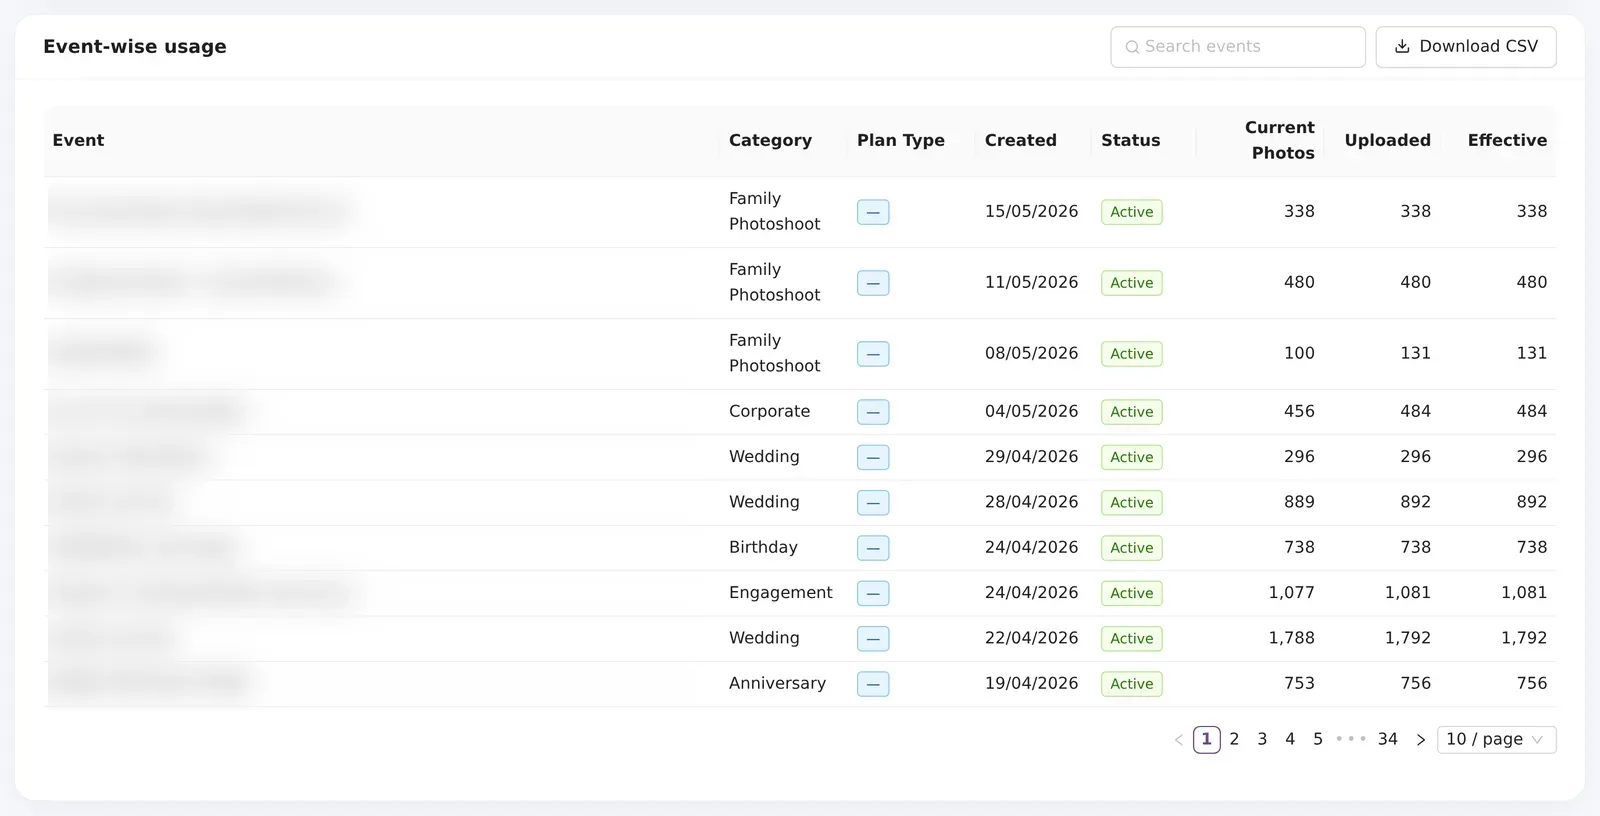
Event-wise usage
The last table has one row per event, newest first. It shows:
- Event, Category and Plan Type.
- Created: the date you created the event.
- Status: Active or Deleted.
- Current Photos: photos in the event now.
- Uploaded: photos uploaded to the event, including ones deleted later.
- Effective: the larger of Current Photos and Uploaded. This is the number added up in Estimated total uploaded photos.
The table shows 10 events per page. Use the page numbers at the bottom to move through them, or change 10 / page to see more at once.
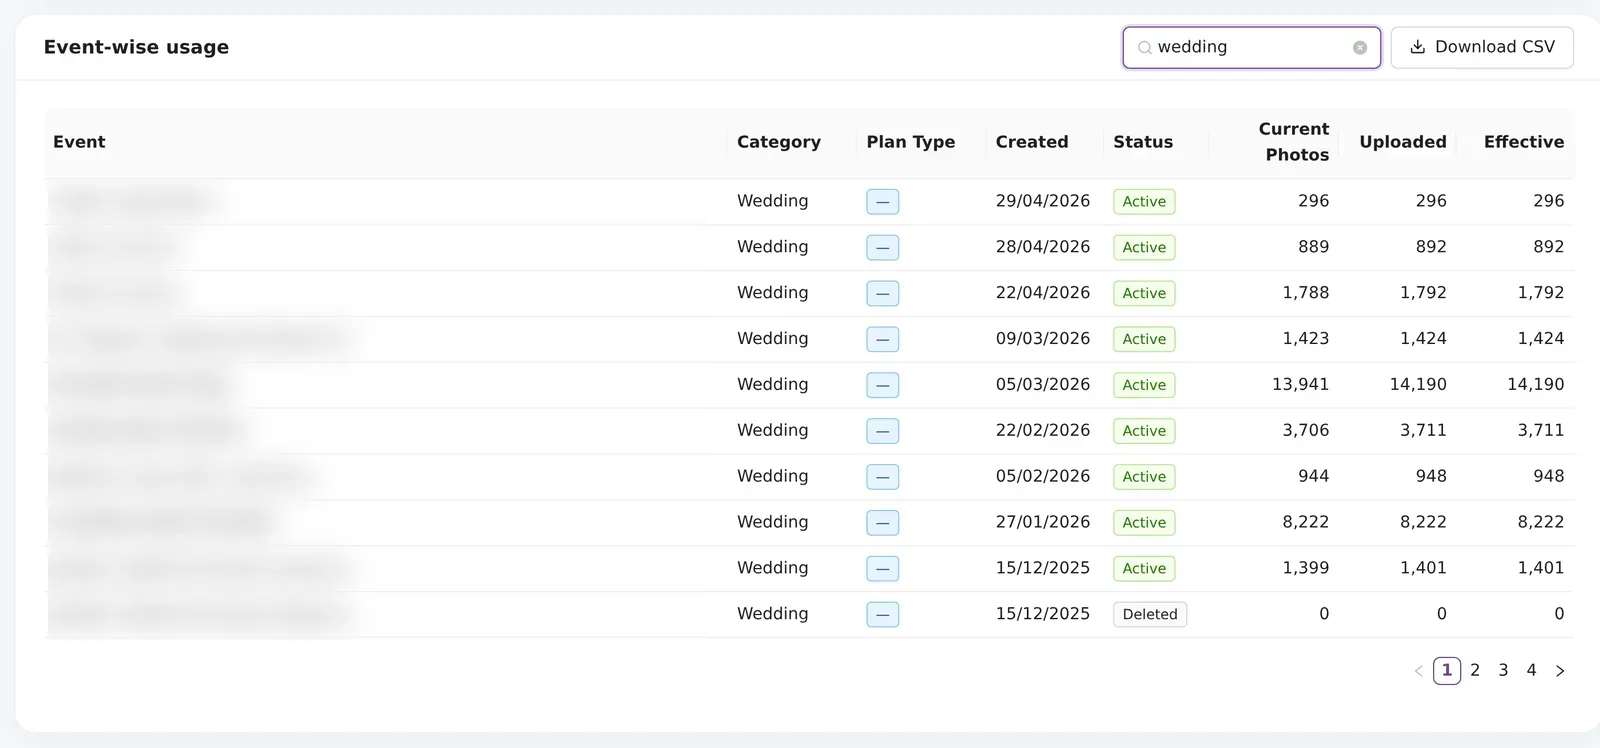
Search events
Type in Search events to filter the table. It matches the event name and category, so typing "wedding" finds every wedding.
Download the CSV
Click Download CSV above the Event-wise usage table. The file has one row per event with these columns: Event, Category, Plan Type, Subscription, Created (IST), Status, Current Photos, Uploaded and Effective.
If you searched first, the file has only the events that match. Clear the search to download every event. The charts and the other tables have no download.
To see live photo counts and expiry dates for each event, use the Events Report.
Frequently asked questions
Can I pick a date range?
No. The Usage Report always covers your whole account, from your first event to the day it was generated. The charts and tables split the numbers by year instead.
Why is the Refresh report button greyed out?
You can refresh the report once every 24 hours. The button is also locked while a new report is being made. It shows Refresh In Progress until the new report is ready.
Why is Estimated total uploaded photos higher than Current live photos?
Current live photos counts only the photos that are in your events today. Estimated total uploaded photos also counts photos you uploaded and later deleted, so it is usually higher.
Why do the photo numbers differ from the Events Report?
The Usage Report is a snapshot from the time shown next to Last generated. The Events Report counts photos live. If you uploaded or deleted photos since the last refresh, the numbers will differ.
Photos I uploaded this year show under an older year. Why?
Photo uploads by year puts every photo under the year its event was created. If you keep adding photos to an event from last year, they count towards last year.
More Reports & account tutorials
Try it in your dashboard
Sign in to Kamero and follow along. Questions? Raise a support ticket from the dashboard.